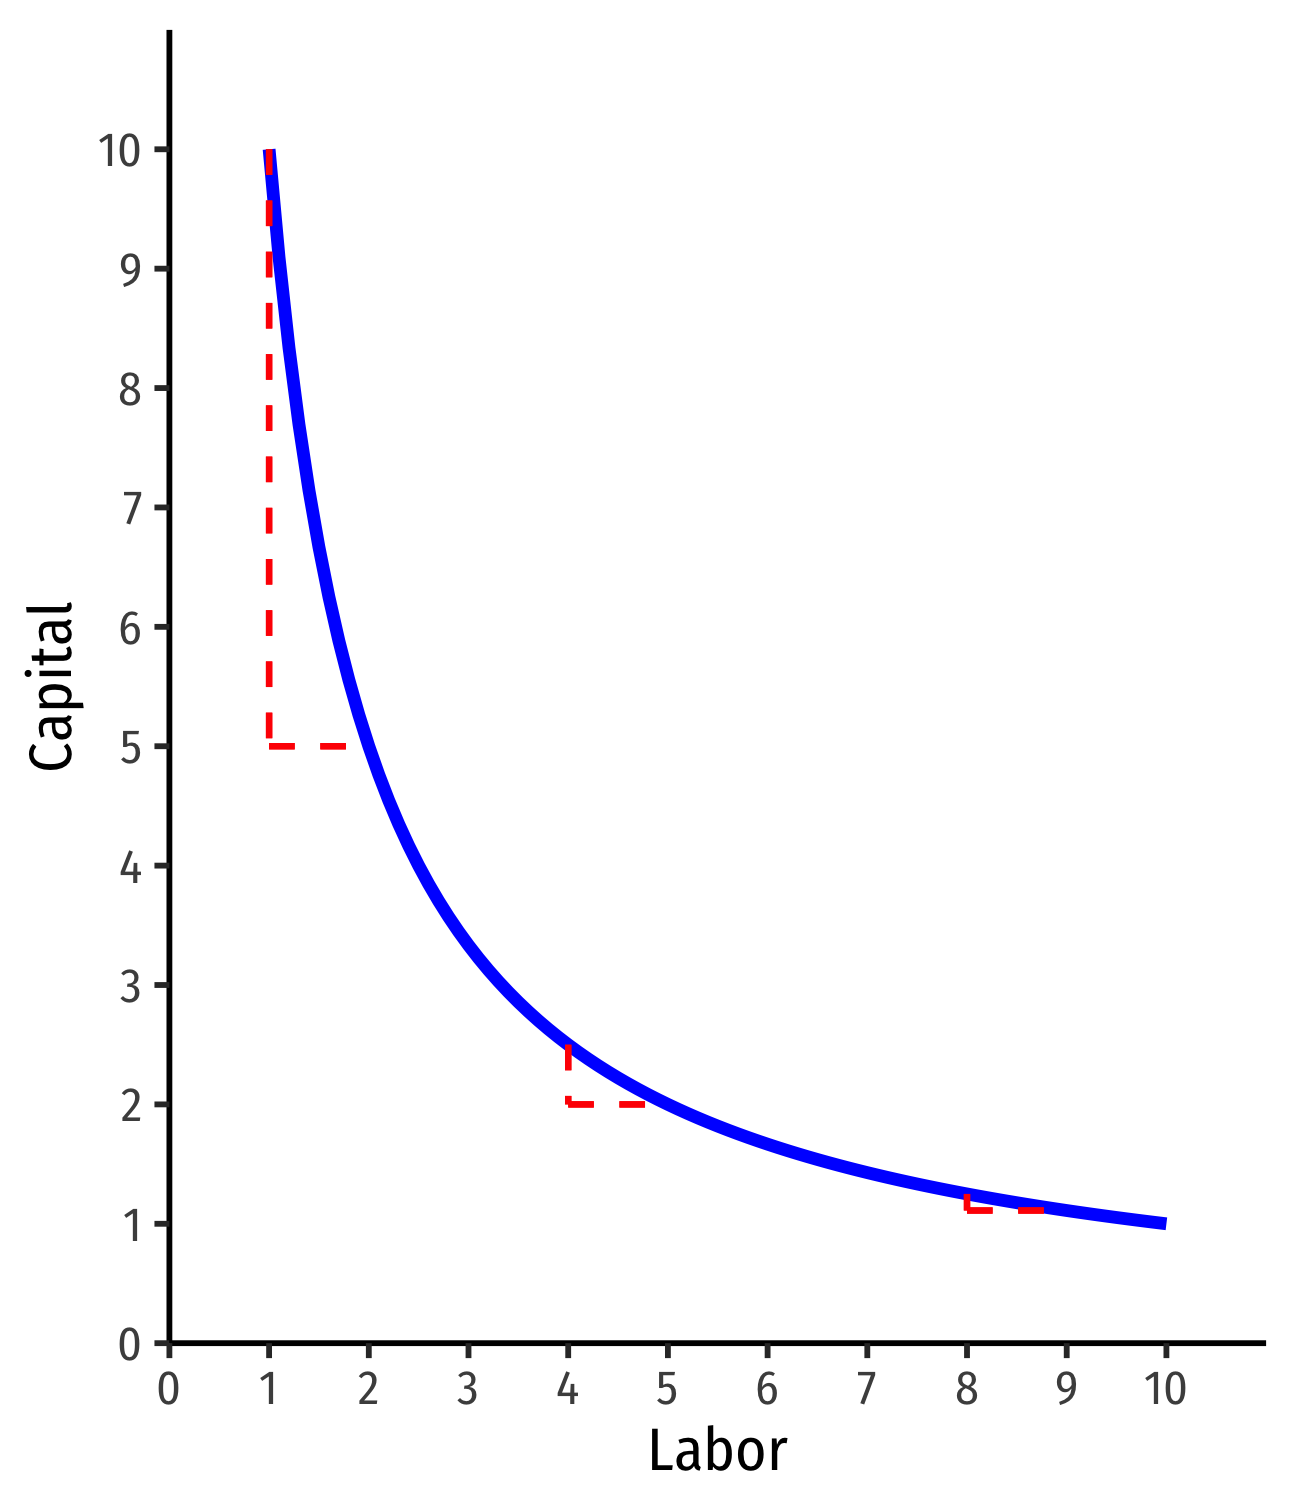
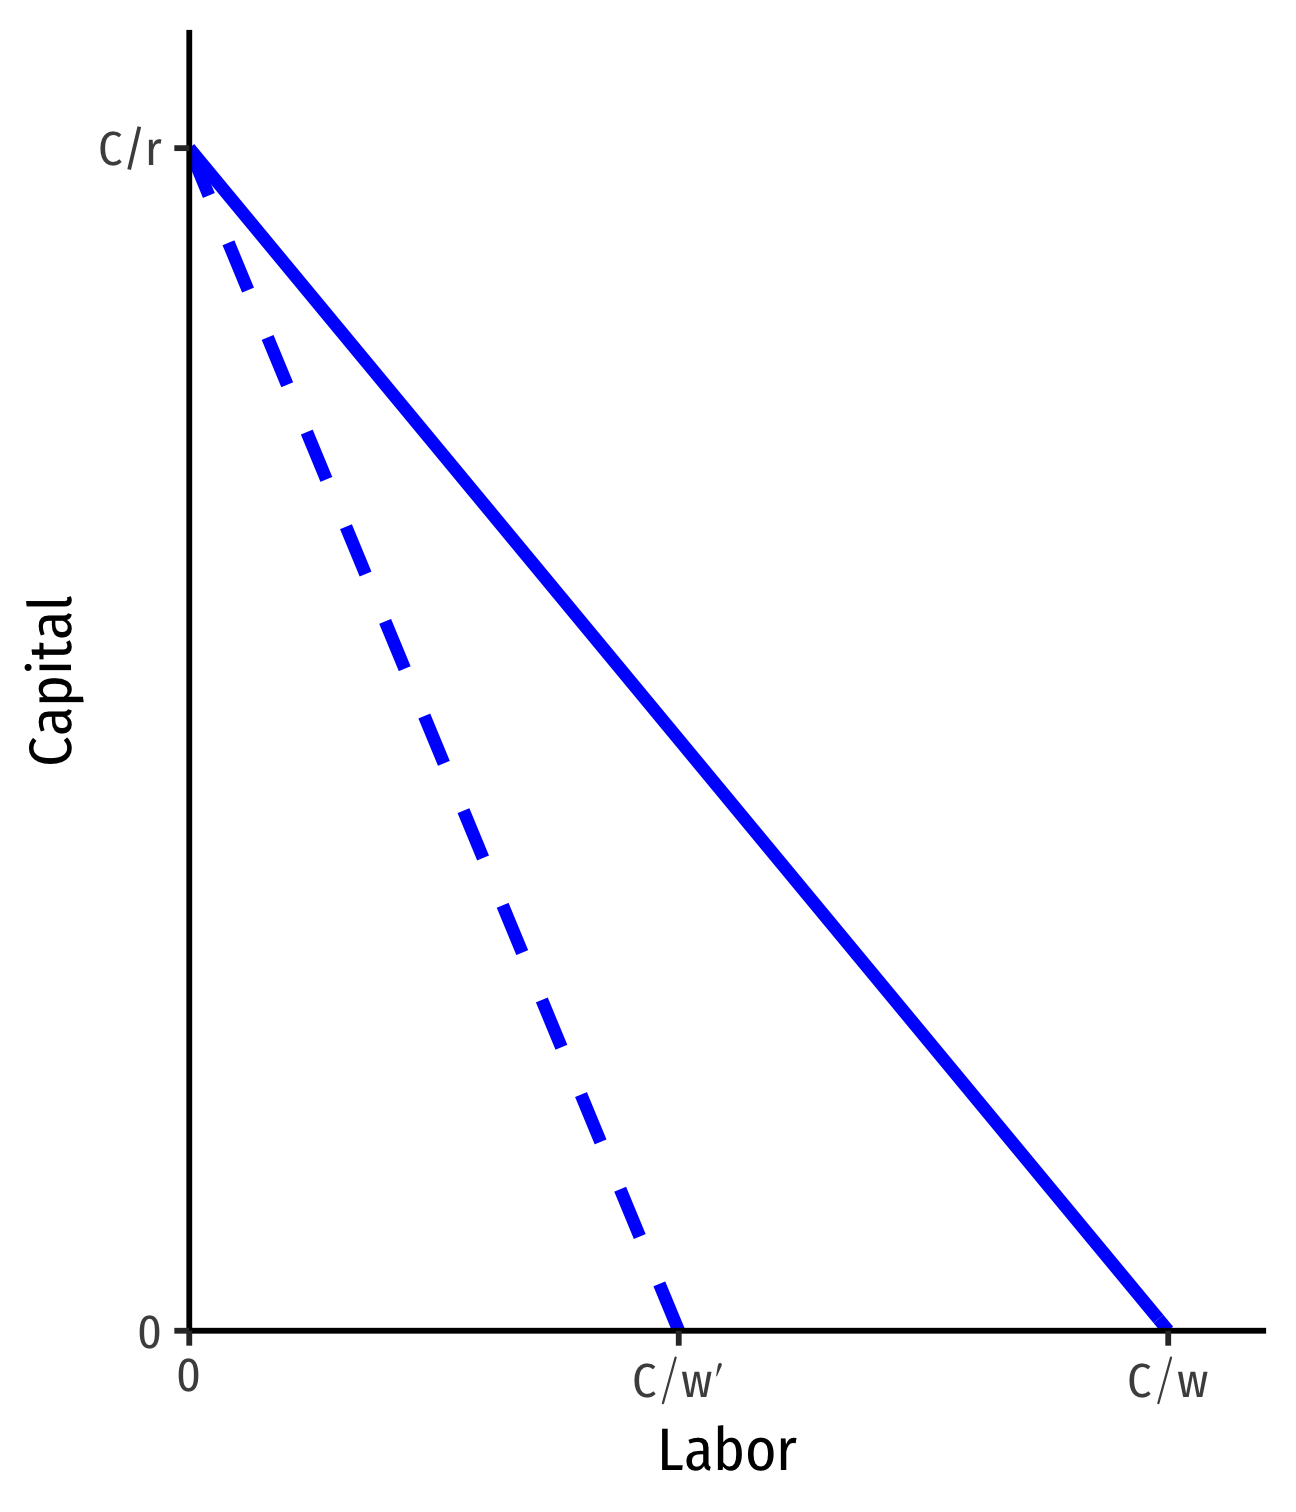
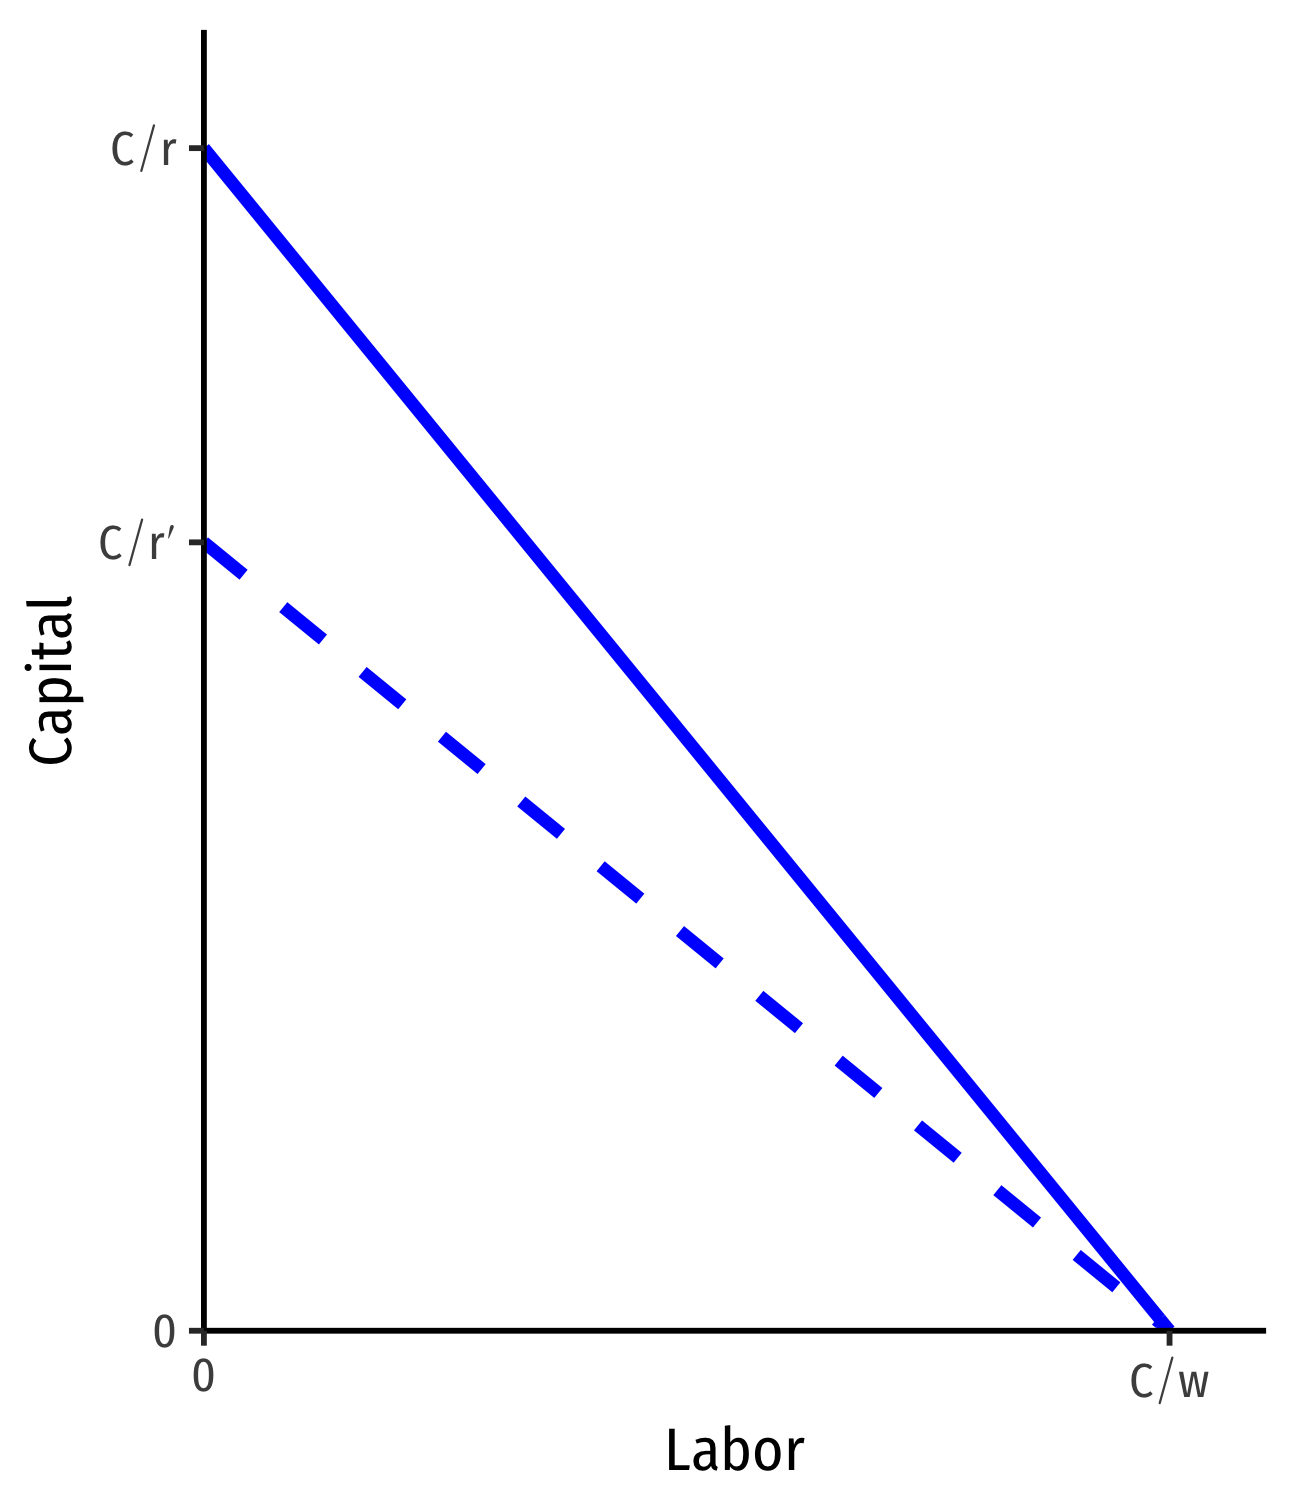
class: center, middle, inverse, title-slide # 2.2 — Short Run and Long Run ## ECON 306 • Microeconomic Analysis • Spring 2021 ### Ryan Safner
Assistant Professor of Economics
safner@hood.edu
ryansafner/microS21
microS21.classes.ryansafner.com
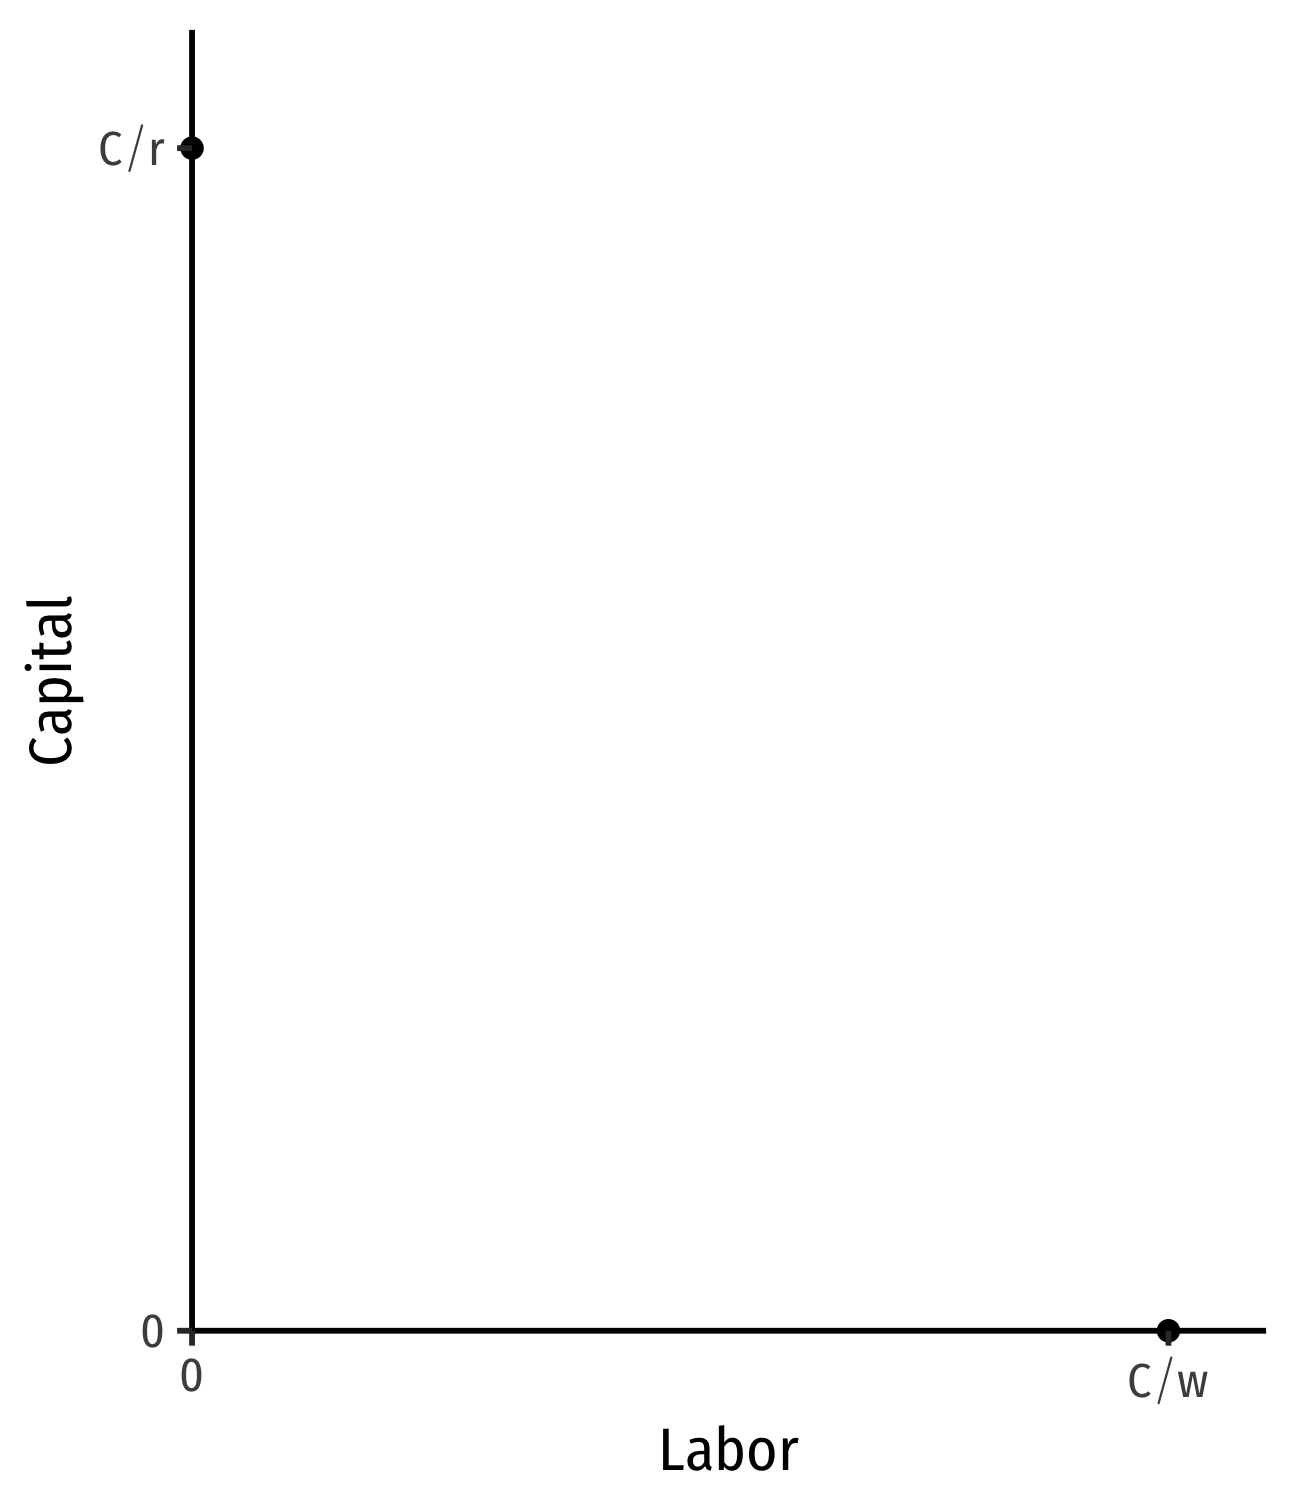
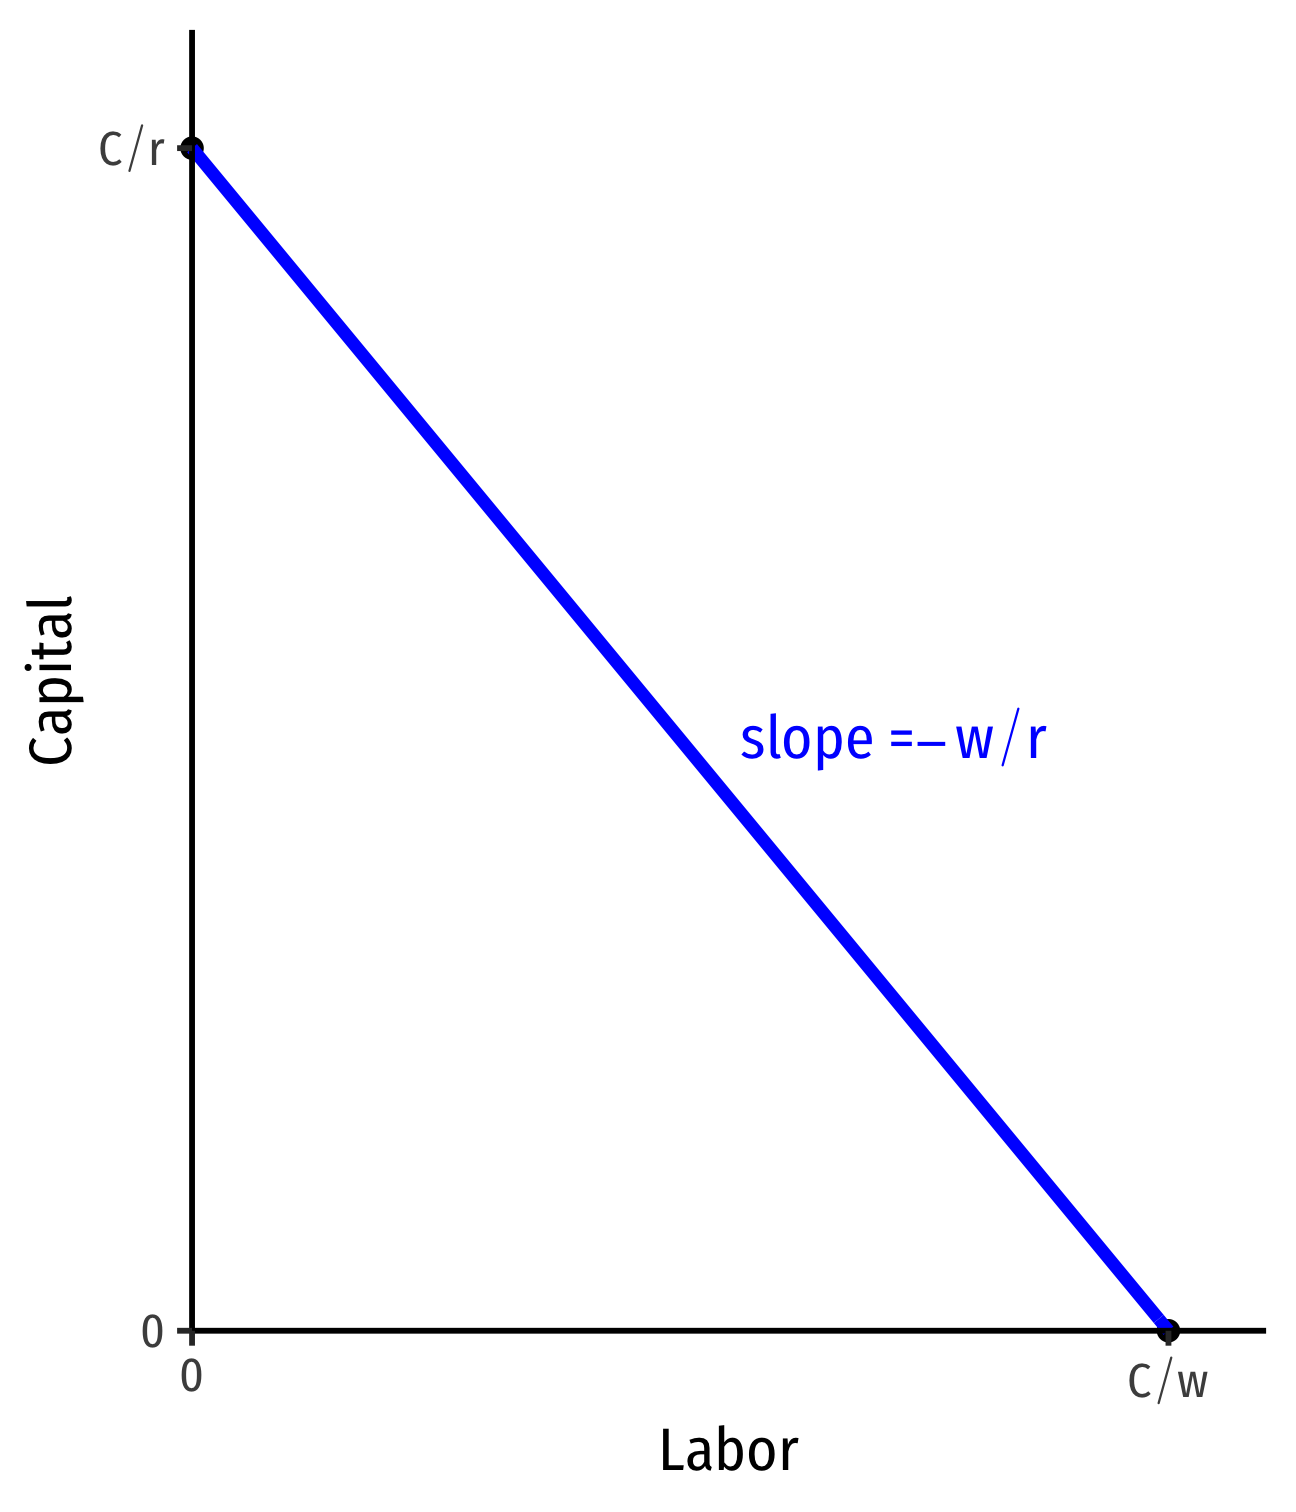
--- class: inverse # Outline ### [Production in the Short Run](#5) ### [The Firm's Problem: Long Run](#16) ### [Isoquants and MRTS](#23) ### [Isocost Lines](#36) --- # The “Runs” of Production .pull-left[ - “Time”-frame usefully divided between short vs. long run analysis - .hi[Short run]: at least one factor of production is .hi-purple[fixed] (too costly to change) `$$q=f(\bar{k},l)$$` - Assume **capital** is fixed (i.e. number of factories, storefronts, etc) - Short-run decisions only about using **labor** ] .pull-right[ .center[ ![:scale 60%](../images/timehourglass.jpg) ] ] --- # The “Runs” of Production .pull-left[ - “Time”-frame usefully divided between short vs. long run analysis - .hi[Long run]: all factors of production are .hi-purple[variable] (can be changed) `$$q=f(k,l)$$` ] .pull-right[ .center[ ![:scale 60%](../images/timehourglass.jpg) ] ] --- class: inverse, center, middle # Production in the Short Run --- # Production in the Short Run: Example .pull-left[ .bg-washed-green.b--dark-green.ba.bw2.br3.shadow-5.ph4.mt5[ .smaller[ .green[**Example**:] Consider a firm with the production function `$$q=k^{0.5}l^{0.5}$$` - Suppose in the short run, the firm has 4 units of capital. ] ] .smallest[ 1. Derive the short run production function. 2. What is the total product (output) that can be made with 4 workers? 3. What is the total product (output) that can be made with 5 workers? ] ] -- .pull-right[ <img src="2.2-slides_files/figure-html/unnamed-chunk-1-1.png" width="504" style="display: block; margin: auto;" /> ] --- # Marginal Products .pull-left[ - The .hi[marginal product] of an input is the *additional* output produced by *one more unit* of that input (*holding all other inputs constant*) - Like marginal utility - Similar to marginal utilities, I will give you the marginal product equations ] .pull-right[ <img src="2.2-slides_files/figure-html/unnamed-chunk-2-1.png" width="504" style="display: block; margin: auto;" /> ] --- # Marginal Product of Labor .pull-left[ - .hi[Marginal product of labor `\\((MP_l)\\)`]: additional output produced by adding one more unit of labor (holding `\(k\)` constant) `$$MP_l = \frac{\Delta q}{\Delta l}$$` - `\(MP_l\)` is slope of `\(TP\)` at each value of `\(l\)`! - Note: via calculus: `\(\frac{\partial q}{\partial l}\)` ] .pull-right[ <img src="2.2-slides_files/figure-html/unnamed-chunk-3-1.png" width="504" style="display: block; margin: auto;" /> <img src="2.2-slides_files/figure-html/unnamed-chunk-4-1.png" width="504" style="display: block; margin: auto;" /> ] --- # Marginal Product of Capital .pull-left[ - .hi[Marginal product of capital `\\((MP_k)\\)`]: additional output produced by adding one more unit of capital (holding `\(l\)` constant) `$$MP_k = \frac{\Delta q}{\Delta k}$$` - `\(MP_k\)` is slope of `\(TP\)` at each value of `\(k\)`! - Note: via calculus: `\(\frac{\partial q}{\partial k}\)` - Note we don't consider capital in the short run! ] .pull-right[ <img src="2.2-slides_files/figure-html/unnamed-chunk-5-1.png" width="504" style="display: block; margin: auto;" /> <img src="2.2-slides_files/figure-html/unnamed-chunk-6-1.png" width="504" style="display: block; margin: auto;" /> ] --- # Diminishing Returns .pull-left[ - .hi-purple[Law of Diminishing Returns]: adding more of one factor of production **holding all others constant** will result in successively lower increases in output - In order to increase output, firm will need to increase *all* factors! ] .pull-right[ <img src="2.2-slides_files/figure-html/unnamed-chunk-7-1.png" width="504" style="display: block; margin: auto;" /> <img src="2.2-slides_files/figure-html/unnamed-chunk-8-1.png" width="504" style="display: block; margin: auto;" /> ] --- # Diminishing Returns .pull-left[ - .hi-purple[Law of Diminishing Returns]: adding more of one factor of production **holding all others constant** will result in successively lower increases in output - In order to increase output, firm will need to increase *all* factors! .center[ ![:scale 70%](../images/toomanycooks.jpg) ] ] .pull-right[ <img src="2.2-slides_files/figure-html/unnamed-chunk-9-1.png" width="504" style="display: block; margin: auto;" /> <img src="2.2-slides_files/figure-html/unnamed-chunk-10-1.png" width="504" style="display: block; margin: auto;" /> ] --- # Production Functions and Marginal Product - A quick trick to roughly<sup>.magenta[†]</sup> estimate `\(MP_l\)` `$$MP_l \approx \frac{q_2-q_1}{l_2-l_1}$$` | `\(l\)` | `\(q\)` | `\(MP_l\)` | |-----|-----|:------:| | `\(0\)` | `\(0.00\)` | `\(-\)` | | `\(1\)` | `\(2.00\)` | `\(2.00-0.00=2.00\)` | | `\(2\)` | `\(2.83\)` | `\(2.83-2.00=0.83\)` | | `\(3\)` | `\(3.46\)` | `\(3.46-2.83=0.63\)` | .footnote[<sup>.magenta[†]</sup> Note these are *approximate*. Technically, `\\(MP_l\\)` is defined via calculus as an *infinitesimal* change in `\\(l\\)`, whereas these are discrete changes.] --- # Average Product of Labor (and Capital) .pull-left[ - .hi[Average product of labor `\\((AP_l)\\)`]: total output per worker `$$AP_l = \frac{q}{l}$$` - A measure of *labor productivity* - .hi[Average product of capital `\\((AP_k)\\)`]: total output per unit of capital `$$AP_k = \frac{q}{k}$$` ] .pull-right[ <img src="2.2-slides_files/figure-html/unnamed-chunk-11-1.png" width="504" style="display: block; margin: auto;" /> <img src="2.2-slides_files/figure-html/unnamed-chunk-12-1.png" width="504" style="display: block; margin: auto;" /> ] --- # Production in the Short Run: Example II .bg-washed-green.b--dark-green.ba.bw2.br3.shadow-5.ph4.mt5[ .green[**Example**:] Suppose a firm has the following production function: `$$q=2k+l^2$$` - Suppose in the short run, the firm has 10 units of capital. ] 1. Write an equation for the short run production function. 2. Calculate the total product(s), marginal product(s), and average product(s) for each of the first 5 workers. --- class: inverse, center, middle # The Firm's Problem: Long Run --- # The Long Run .pull-left[ - In the long run, *all* factors of production are .hi-purple[variable] `$$q=f(k,l)$$` - Can build more factories, open more storefronts, rent more space, invest in machines, etc. - So the firm can choose both `\(l\)` *and* `\(k\)` ] .pull-right[ .center[ ![](../images/chooselocations.jpg) ] ] --- # The Firm's Problem .pull-left[ .smallest[ - Based on what we've discussed, we can fill in a constrained optimization model for the firm - But don't write this one down just yet! - The **firm's problem** is: 1. **Choose:** .hi-blue[ < inputs and output >] 2. **In order to maximize:** .hi-green[< profits >] 3. **Subject to:** .hi-red[< technology >] - It's actually much easier to break this into **2 stages**. See today’s [class notes](/content/2.1-content) page for an example using only one stage. ] ] .pull-right[ .center[ ![](../images/management.jpg) ] ] --- # The Firm's Two Problems .pull-left[ .smallest[ 1<sup>st</sup> Stage: .hi[firm's profit maximization problem]: 1. **Choose:** .hi-blue[ < output >] 2. **In order to maximize:** .hi-green[< profits >] - We'll cover this later...first we'll explore: ] ] .pull-right[ .center[ ![](../images/management.jpg) ] ] --- # The Firm's Two Problems .pull-left[ .smallest[ 1<sup>st</sup> Stage: .hi[firm's profit maximization problem]: 1. **Choose:** .hi-blue[ < output >] 2. **In order to maximize:** .hi-green[< profits >] - We'll cover this later...first we'll explore: 2<sup>nd</sup> Stage: .hi[firm's cost minimization problem]: 1. **Choose:** .hi-blue[ < inputs >] 2. **In order to _minimize_:** .hi-green[< cost >] 3. **Subject to:** .hi-red[< producing the optimal output >] - Minimizing costs `\(\iff\)` maximizing profits ] ] .pull-right[ .center[ ![](../images/management.jpg) ] ] --- # Long Run Production .pull-left[ .green[**Example**]: `\(q=\sqrt{lk}\)` <table class="table" style="width: auto !important; margin-left: auto; margin-right: auto;"> <thead> <tr> <th style="empty-cells: hide;border-bottom:hidden;" colspan="2"></th> <th style="border-bottom:hidden;padding-bottom:0; padding-left:3px;padding-right:3px;text-align: center; " colspan="6"><div style="border-bottom: 1px solid #ddd; padding-bottom: 5px; ">k</div></th> </tr> <tr> <th style="text-align:left;"> </th> <th style="text-align:left;"> </th> <th style="text-align:left;"> 0 </th> <th style="text-align:left;"> 1 </th> <th style="text-align:left;"> 2 </th> <th style="text-align:left;"> 3 </th> <th style="text-align:left;"> 4 </th> <th style="text-align:left;"> 5 </th> </tr> </thead> <tbody> <tr> <td style="text-align:left;font-weight: bold;vertical-align: middle !important;" rowspan="6"> l </td> <td style="text-align:left;font-weight: bold;"> 0 </td> <td style="text-align:left;"> 0.00 </td> <td style="text-align:left;"> 0.00 </td> <td style="text-align:left;"> 0.00 </td> <td style="text-align:left;"> 0.00 </td> <td style="text-align:left;"> 0.00 </td> <td style="text-align:left;"> 0.00 </td> </tr> <tr> <td style="text-align:left;font-weight: bold;"> 1 </td> <td style="text-align:left;"> 0.00 </td> <td style="text-align:left;"> 1.00 </td> <td style="text-align:left;"> 1.41 </td> <td style="text-align:left;"> 1.73 </td> <td style="text-align:left;"> 2.00 </td> <td style="text-align:left;"> 2.24 </td> </tr> <tr> <td style="text-align:left;font-weight: bold;"> 2 </td> <td style="text-align:left;"> 0.00 </td> <td style="text-align:left;"> 1.41 </td> <td style="text-align:left;"> 2.00 </td> <td style="text-align:left;"> 2.45 </td> <td style="text-align:left;"> 2.83 </td> <td style="text-align:left;"> 3.16 </td> </tr> <tr> <td style="text-align:left;font-weight: bold;"> 3 </td> <td style="text-align:left;"> 0.00 </td> <td style="text-align:left;"> 1.73 </td> <td style="text-align:left;"> 2.45 </td> <td style="text-align:left;"> 3.00 </td> <td style="text-align:left;"> 3.46 </td> <td style="text-align:left;"> 3.87 </td> </tr> <tr> <td style="text-align:left;font-weight: bold;"> 4 </td> <td style="text-align:left;"> 0.00 </td> <td style="text-align:left;"> 2.00 </td> <td style="text-align:left;"> 2.83 </td> <td style="text-align:left;"> 3.46 </td> <td style="text-align:left;"> 4.00 </td> <td style="text-align:left;"> 4.47 </td> </tr> <tr> <td style="text-align:left;font-weight: bold;"> 5 </td> <td style="text-align:left;"> 0.00 </td> <td style="text-align:left;"> 2.24 </td> <td style="text-align:left;"> 3.16 </td> <td style="text-align:left;"> 3.87 </td> <td style="text-align:left;"> 4.47 </td> <td style="text-align:left;"> 5.00 </td> </tr> </tbody> </table> ] .pull-right[ - Many input-combinations yield the same output! - So how does the firm choose the *optimal* combination?? ] --- # Mapping Input-Combination Choices Graphically .pull-left[ .center[ 3-D Production Function
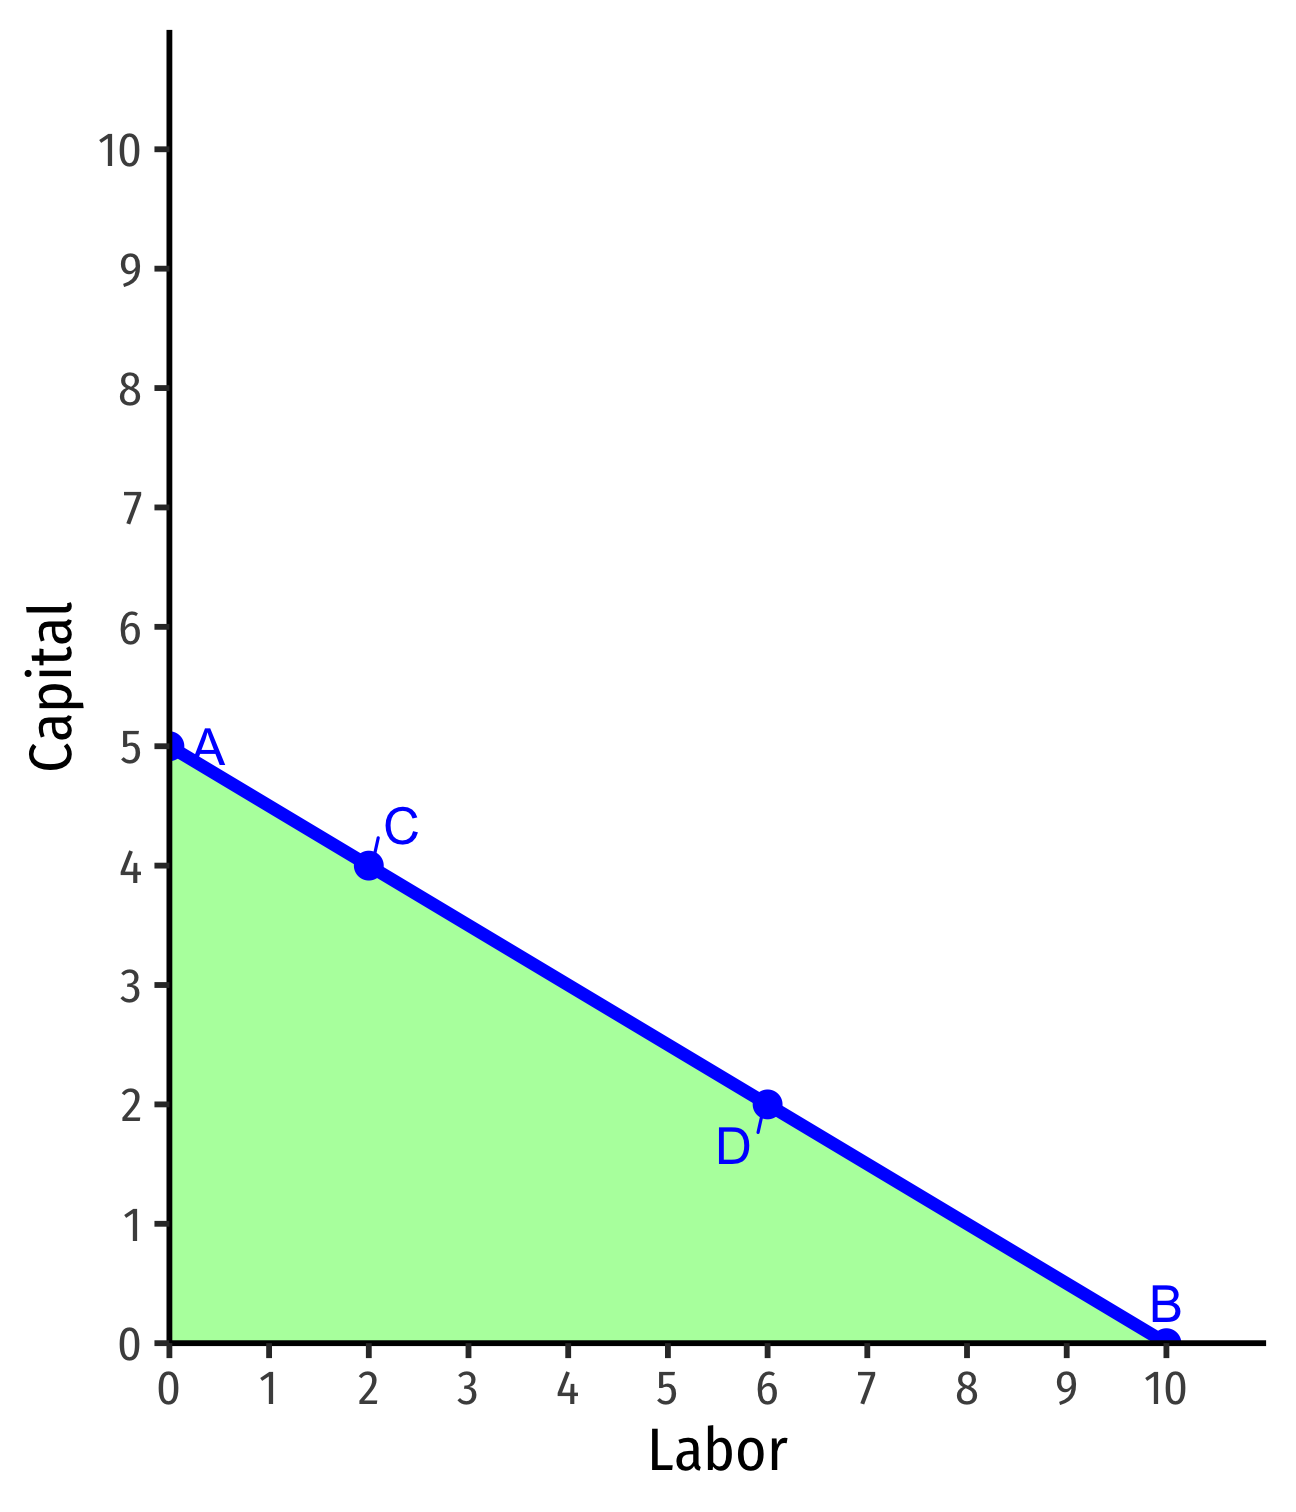
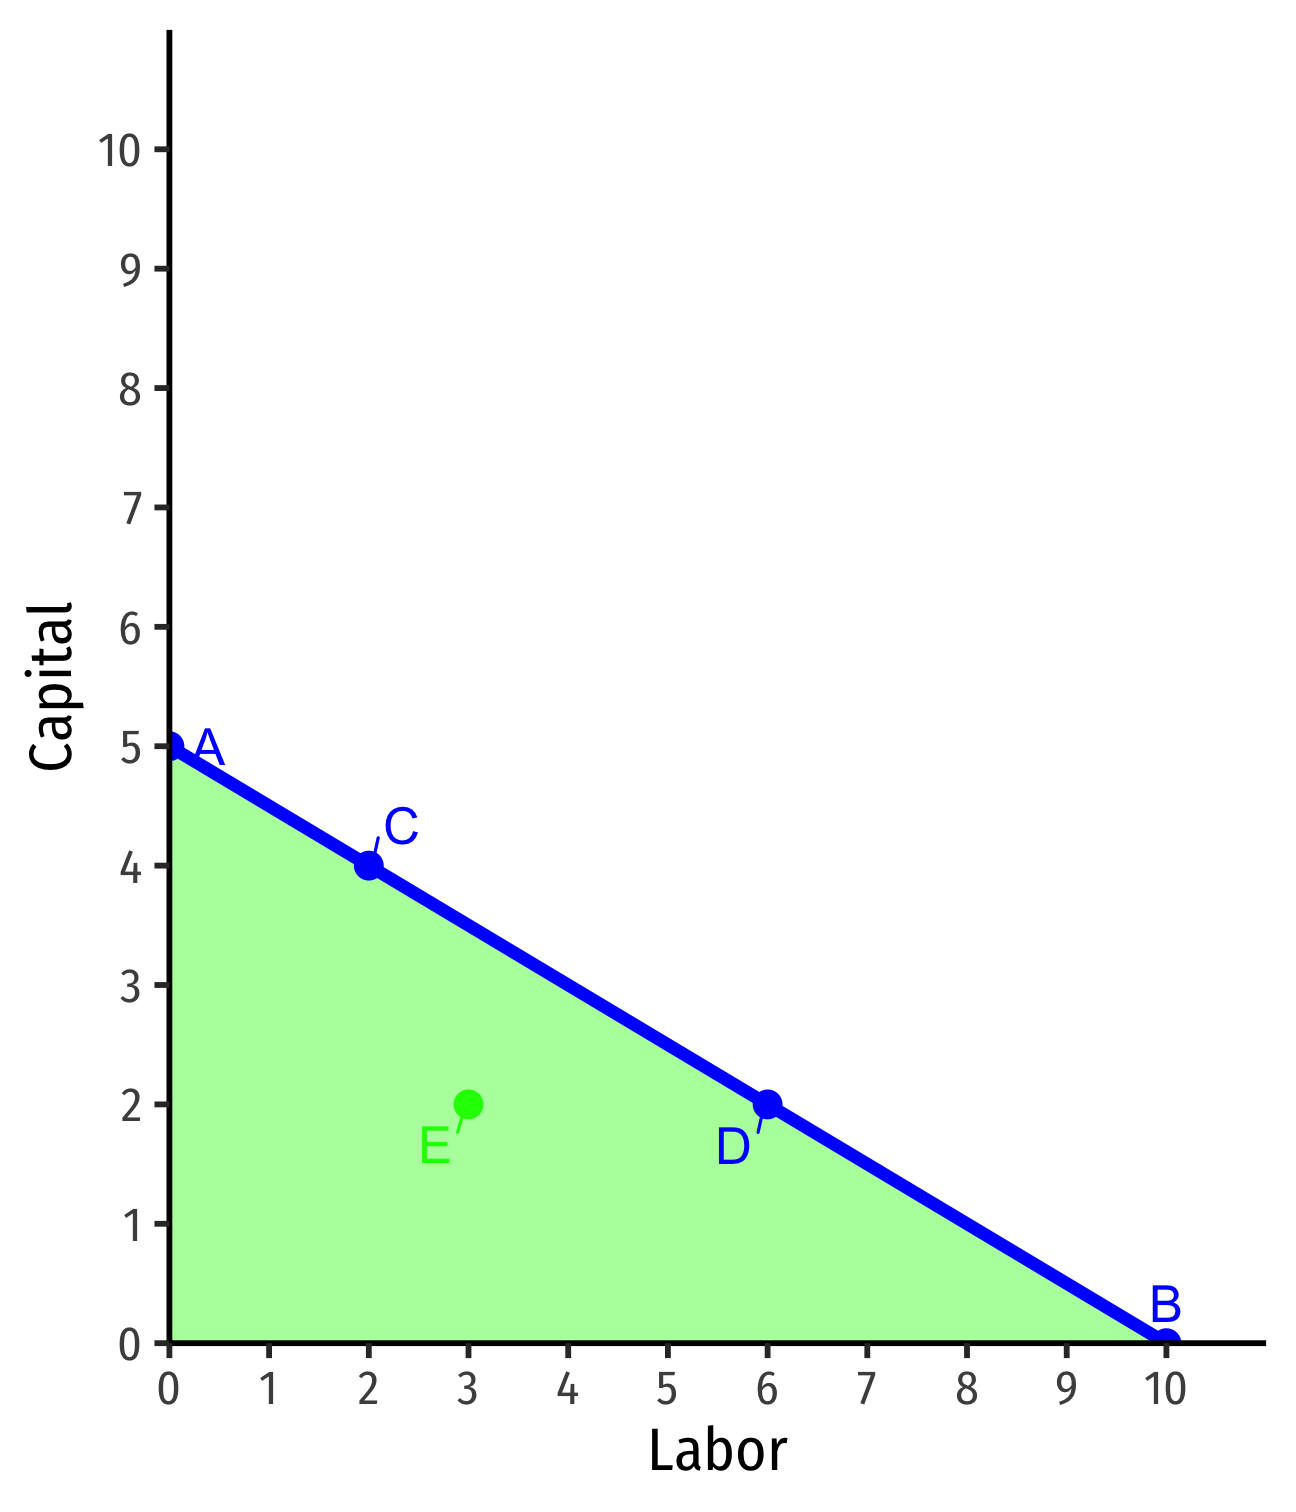
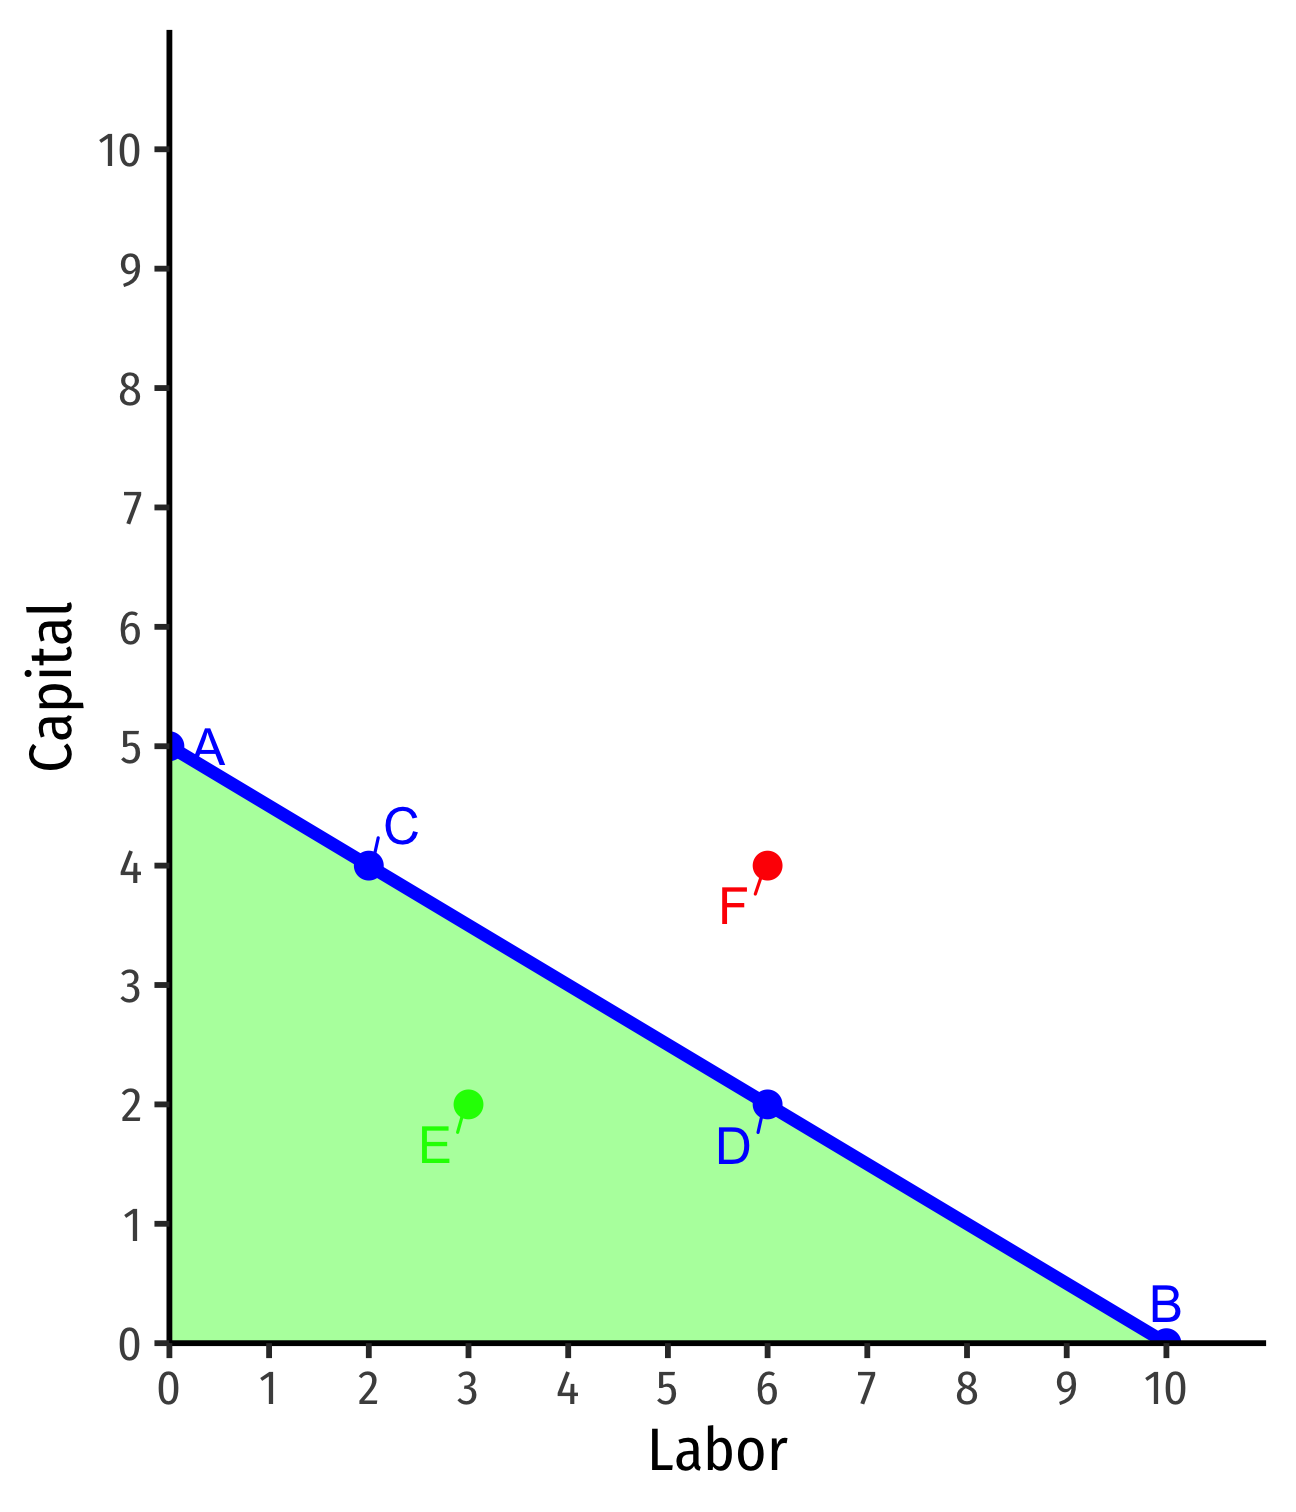
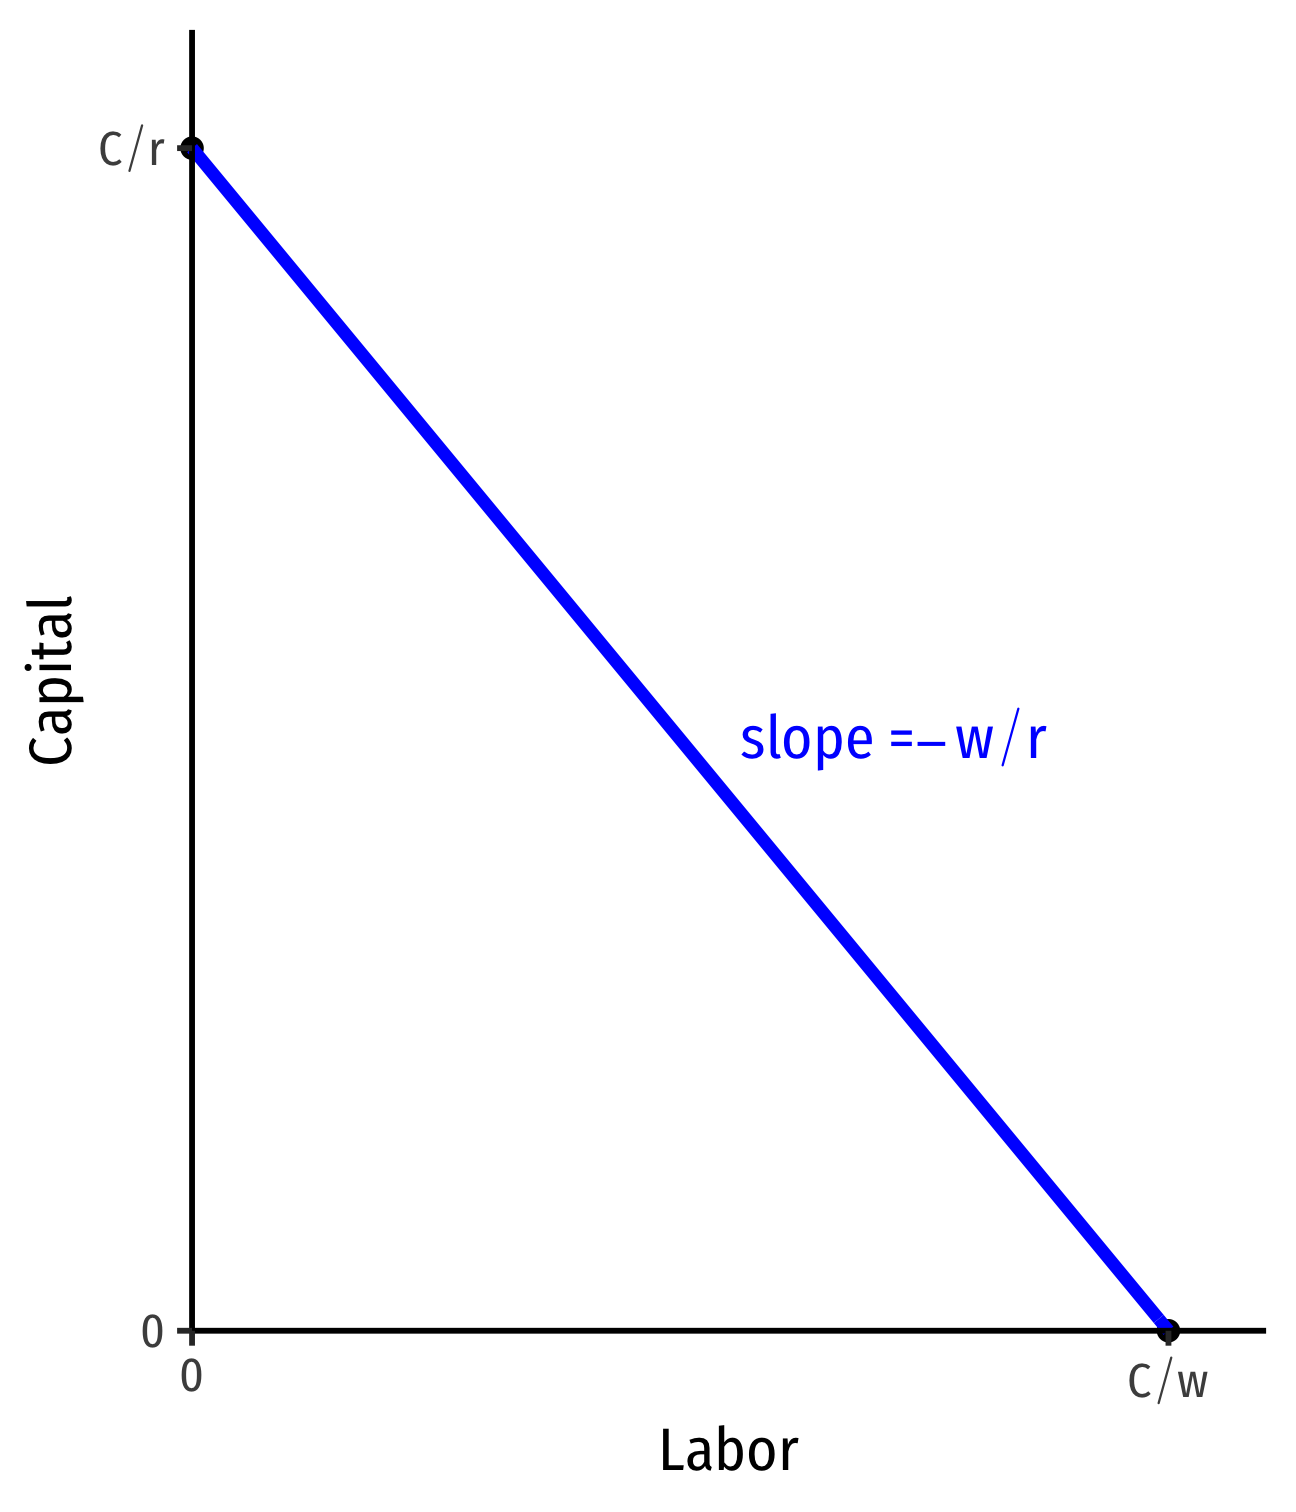
] ] .pull-right[ .center[ 2-D Isoquant Contours <img src="2.2-slides_files/figure-html/unnamed-chunk-15-1.png" width="504" style="display: block; margin: auto;" /> ] ] --- class: inverse, center, middle # Isoquants and MRTS --- # Isoquant Curves .pull-left[ - We can draw an .hi-blue[isoquant] indicating all combinations of `\(l\)` and `\(k\)` that yield the same `\(q\)` ] .pull-right[ <img src="2.2-slides_files/figure-html/unnamed-chunk-16-1.png" width="504" style="display: block; margin: auto;" /> ] --- # Isoquant Curves .pull-left[ - We can draw an .hi-blue[isoquant] indicating all combinations of `\(l\)` and `\(k\)` that yield the same `\(q\)` - Combinations *above* curve yield .hi-green[more output]; on a .hi-green[higher curve] - `\(D > A = B = C\)` ] .pull-right[ <img src="2.2-slides_files/figure-html/unnamed-chunk-17-1.png" width="504" style="display: block; margin: auto;" /> ] --- # Isoquant Curves .pull-left[ - We can draw an .hi-blue[isoquant] indicating all combinations of `\(l\)` and `\(k\)` that yield the same `\(q\)` - Combinations *above* curve yield .hi-green[more output]; on a .hi-green[higher curve] - `\(D > A = B = C\)` - Combinations *below* the curve yield .hi-red[less output]; on a .hi-red[lower curve] - `\(E < A = B = C\)` ] .pull-right[ <img src="2.2-slides_files/figure-html/unnamed-chunk-18-1.png" width="504" style="display: block; margin: auto;" /> ] --- # Marginal Rate of *Technical* Substitution I .pull-left[ - If your firm uses fewer workers, how much more capital would it need to produce the same amount? ] .pull-right[ .center[ ![:scale 80%](../images/scale.png) ] ] --- # Marginal Rate of *Technical* Substitution I .pull-left[ - If your firm uses fewer workers, how much more capital would it need to produce the same amount? - .hi[Marginal Rate of Technical Substitution (MRTS)]: rate at which firm trades off one input for another to *yield same output* - Firm's .hi-purple[relative value] of using `\(l\)` in production based on its tech: > “We could give up (MRTS) units of k to use 1 more unit of l to produce the same output.” ] .pull-right[ .center[ ![:scale 80%](../images/scale.png) ] ] --- # Marginal Rate of *Technical* Substitution II .center[ ![](../images/mrsmeme.jpg) ] --- # Marginal Rate of *Technical* Substitution II .pull-left[ - MRTS is the slope of the isoquant `$$MRTS_{l,k}=-\frac{\Delta k}{\Delta l} = \frac{rise}{run}$$` - Amount of `\(k\)` given up for 1 more `\(l\)` - Note: slope (MRTS) changes along the curve! - .hi-purple[Law of diminishing returns]! ] .pull-right[ <img src="2.2-slides_files/figure-html/MRS-1.png" width="432" style="display: block; margin: auto;" /> ] --- # MRTS and Marginal Products .pull-left[ - Relationship between `\(MP\)` and `\(MRTS\)`: `$$\begin{align*} \underbrace{\frac{\Delta k}{\Delta l}}_{MRTS} &= -\frac{MP_l}{MP_k}\\ \end{align*}$$` - See proof in [today's class notes](/content/2.2-content) - Sound familiar? 🧐 ] .pull-right[ <img src="2.2-slides_files/figure-html/unnamed-chunk-19-1.png" width="432" style="display: block; margin: auto;" /> ] --- # Special Case I: Perfect Substitutes .pull-left[ .bg-washed-green.b--dark-green.ba.bw2.br3.shadow-5.ph4.mt5[ .green[**Example**]: Consider Bank Tellers `\\((l)\\)` and ATMs `\\((k)\\)` ] - Suppose 1 ATM can do the work of 2 bank tellers - .hi[Perfect substitutes]: inputs that can be substituted at same fixed rate and yield same output - `\(MRTS_{l,k}=-0.5\)` (a constant!) ] .pull-right[ <img src="2.2-slides_files/figure-html/unnamed-chunk-20-1.png" width="504" style="display: block; margin: auto;" /> ] --- # Special Case II: Perfect Complements .pull-left[ .bg-washed-green.b--dark-green.ba.bw2.br3.shadow-5.ph4.mt5[ .green[**Example**]: Consider buses `\\((k)\\)` and bus drivers `\\((l)\\)` ] - Must combine together in fixed proportions (1:1) - .hi[Perfect complements]: inputs must be used together in same fixed proportion to produce output - `\(MRTS_{l,k}\)`: ? ] .pull-right[ <img src="2.2-slides_files/figure-html/unnamed-chunk-21-1.png" width="504" style="display: block; margin: auto;" /> ] --- # Common Case: Cobb-Douglas Production Functions .pull-left[ - Again: very common functional form in economics is .hi[Cobb-Douglas] `$$q=A \, k^al^b$$` - Where `\(a, b >0\)` - often `\(a+b=1\)` - `\(A\)` is total factor productivity ] .pull-right[ <img src="2.2-slides_files/figure-html/unnamed-chunk-22-1.png" width="504" style="display: block; margin: auto;" /> ] --- # Practice .smallest[ .bg-washed-green.b--dark-green.ba.bw2.br3.shadow-5.ph4.mt5[ .green[**Example**]: Suppose a firm has the following production function: `$$q=2lk$$` Where its marginal products are: `$$\begin{align*} MP_l&=2k\\ MP_k&=2l\\ \end{align*}$$` 1. Put `\(l\)` on the horizontal axis and `\(k\)` on the vertical axis. Write an equation for `\(MRTS_{l,k}\)`. 2. Would input combinations of `\((1, 4)\)` and `\((2, 2)\)` be on the same isoquant? 3. Sketch a graph of the isoquant from part 2. ] ] --- class: inverse, center, middle # Isocost Lines --- # Isocost Lines .pull-left[ .smallest[ - If your firm can choose among *many* input combinations to produce `\(q\)`, which combinations are optimal? - Those combination that are .hi-purple[cheapest] - Denote prices of each input as: - `\(w\)`: price of labor (wage) - `\(r\)`: price of capital - Let `\(C\)` be .hi[total cost] of using inputs `\((l,k)\)` at market prices `\((w,r)\)` to produce `\(q\)` units of output: `$$C(w,r,q)=wl+rk$$` ] ] .pull-right[ .center[ ![:scale 100%](../images/priceguarantee.jpg) ] ] --- # The Isocost Line, Graphically .pull-left[ `$$wl+rk=C$$` ] --- # The Isocost Line, Graphically .pull-left[ `$$wl+rk=C$$` - Solve for `\(k\)` to graph `$$k=\frac{C}{r}-\frac{w}{r}l$$` ] .pull-right[ <img src="2.2-slides_files/figure-html/BC-plot0-1.png" width="432" style="display: block; margin: auto;" /> ] --- # The Isocost Line, Graphically .pull-left[ `$$wl+rk=C$$` - Solve for `\(k\)` to graph `$$k=\frac{C}{r}-\frac{w}{r}l$$` - Vertical-intercept: `\(\frac{C}{r}\)` - Horizontal-intercept: `\(\frac{C}{w}\)` ] .pull-right[ <img src="2.2-slides_files/figure-html/BC-plot1-1.png" width="432" style="display: block; margin: auto;" /> ] --- # The Isocost Line, Graphically .pull-left[ `$$wl+rk=C$$` - Solve for `\(k\)` to graph `$$k=\frac{C}{r}-\frac{w}{r}l$$` - Vertical-intercept: `\(\frac{C}{r}\)` - Horizontal-intercept: `\(\frac{C}{w}\)` - slope: `\(-\frac{w}{r}\)` ] .pull-right[ <img src="2.2-slides_files/figure-html/BC-plot2-1.png" width="432" style="display: block; margin: auto;" /> ] --- # The Isocost Line: Example .bg-washed-green.b--dark-green.ba.bw2.br3.shadow-5.ph4.mt5[ .green[**Example**]: Suppose your firm has a purchasing budget of $50. Market wages are $5/worker-hour and the mark rental rate of capital is $10/machine-hour. Let `\(l\)` be on the horizontal axis and `\(k\)` be on the vertical axis. 1. Write an equation for the isocost line (in graphable form). 2. Graph the isocost line. ] --- # Interpreting Isocost Line .pull-left[ .smallest[ - Points .blue[on] the line are same total cost - A: \\($5(0l)+$10(5k) = $50\\) - B: \\($5(10l)+$10(0k) = $50\\) - C: \\($5(2l)+$10(4k) = $50\\) - D: \\($5(6l)+$10(2k) = $50\\) ] ] .pull-right[ <img src="2.2-slides_files/figure-html/BC2-plot1-1.png" width="432" style="display: block; margin: auto;" /> ] --- # Interpreting Isocost Line .pull-left[ .smallest[ - Points .blue[on] the line are same total cost - A: \\($5(0l)+$10(5k) = $50\\) - B: \\($5(10l)+$10(0k) = $50\\) - C: \\($5(2l)+$10(4k) = $50\\) - D: \\($5(6l)+$10(2k) = $50\\) - Points .green[beneath] the line are .green[cheaper] (but may produce less) - E: \\($5(3l)+$10(2k) = $35\\) ] ] .pull-right[ <img src="2.2-slides_files/figure-html/BC2-plot2-1.png" width="432" style="display: block; margin: auto;" /> ] --- # Interpreting the Isocost Line .pull-left[ .smallest[ - Points .blue[on] the line are same total cost - A: \\($5(0l)+$10(5k) = $50\\) - B: \\($5(10l)+$10(0k) = $50\\) - C: \\($5(2l)+$10(4k) = $50\\) - D: \\($5(6l)+$10(2k) = $50\\) - Points .green[beneath] the line are .green[cheaper] (but may produce less) - E: \\($5(3l)+$10(2k) = $35\\) - Points .red[above] the line are .red[more expensive] (and may produce more) - F: \\($5(6l)+$10(4k) = $70\\) ] ] .pull-right[ <img src="2.2-slides_files/figure-html/BC2-plot3-1.png" width="432" style="display: block; margin: auto;" /> ] --- # Interpretting the Slope .pull-left[ - **Slope**: .hi-purple[tradeoff] between `\(l\)` and `\(k\)` at market prices - Market .hi-purple[“exchange rate”] between `\(l\)` and `\(k\)` - .hi-purple[*Relative* price] of `\(l\)` or the .hi-purple[opportunity cost] of `\(l\)`: > Hiring 1 more unit of `\(l\)` requires giving up `\(\left(\frac{w}{r}\right)\)` units of `\(k\)` ] .pull-right[ <img src="2.2-slides_files/figure-html/BC-slope-plot-1.png" width="432" style="display: block; margin: auto;" /> ] --- # Changes in Relative Factor Prices I .pull-left[ .smallest[ - Changes in .hi-purple[relative factor prices]: *rotate* the line .hi-green[**Example**]: An increase in the price of `\(l\)` - Slope changes: `\(-\frac{w'}{r}\)` ] .center[ ![:scale 75%](../images/minwagerobot.jpg) ] ] .pull-right[ <img src="2.2-slides_files/figure-html/BC-x-change-plot-1.png" width="432" style="display: block; margin: auto;" /> ] --- # Changes in Relative Factor Prices II .pull-left[ .smallest[ - Changes in .hi-purple[relative factor prices]: *rotate* the line .hi-green[**Example**]: An increase in the price of `\(k\)` - Slope changes: `\(-\frac{w}{r'}\)` ] .center[ ![:scale 45%](../images/shortageofrobots.jpg) ] ] .pull-right[ <img src="2.2-slides_files/figure-html/BC-y-change-plot-1.png" width="432" style="display: block; margin: auto;" /> ]